Measurements and Graph
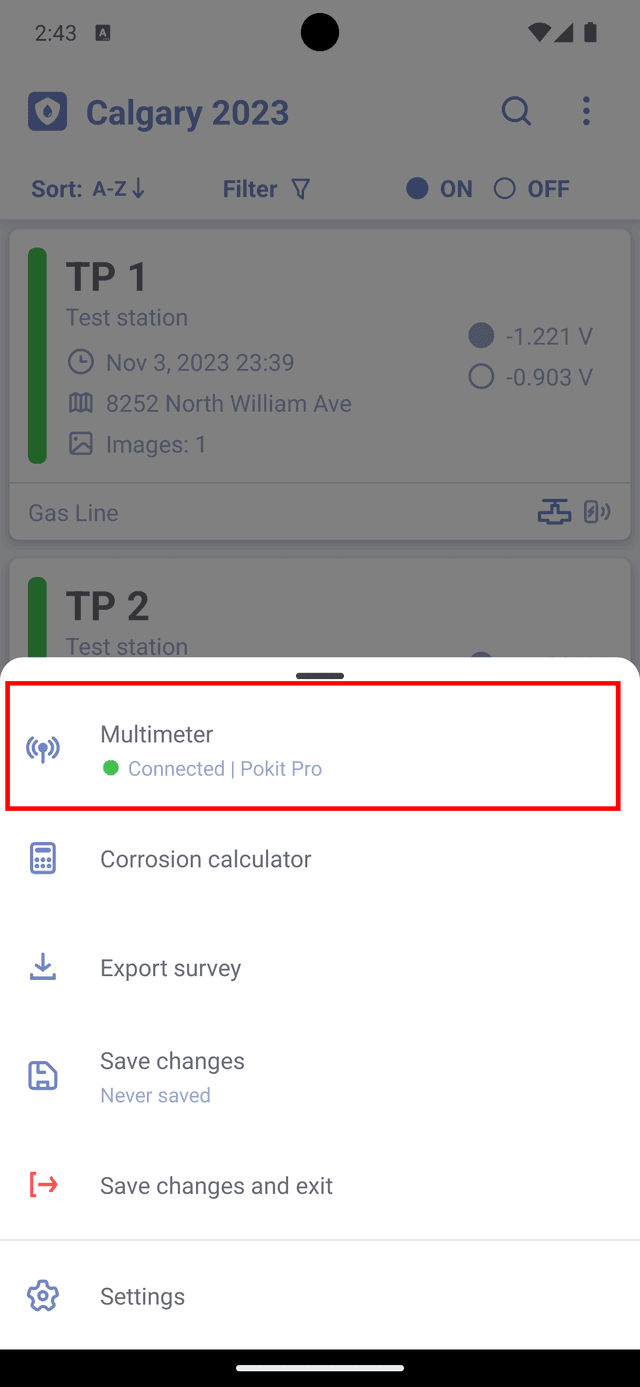
You can access connected multimeter to view currently measured readings. It's available from the main menu or from 'Settings' -> 'Digital multimeter' -> 'Measurements'.
Available modes are displayed at the top part of the screen. Switch the toggle on the multimeter (if available) to view other available modes.
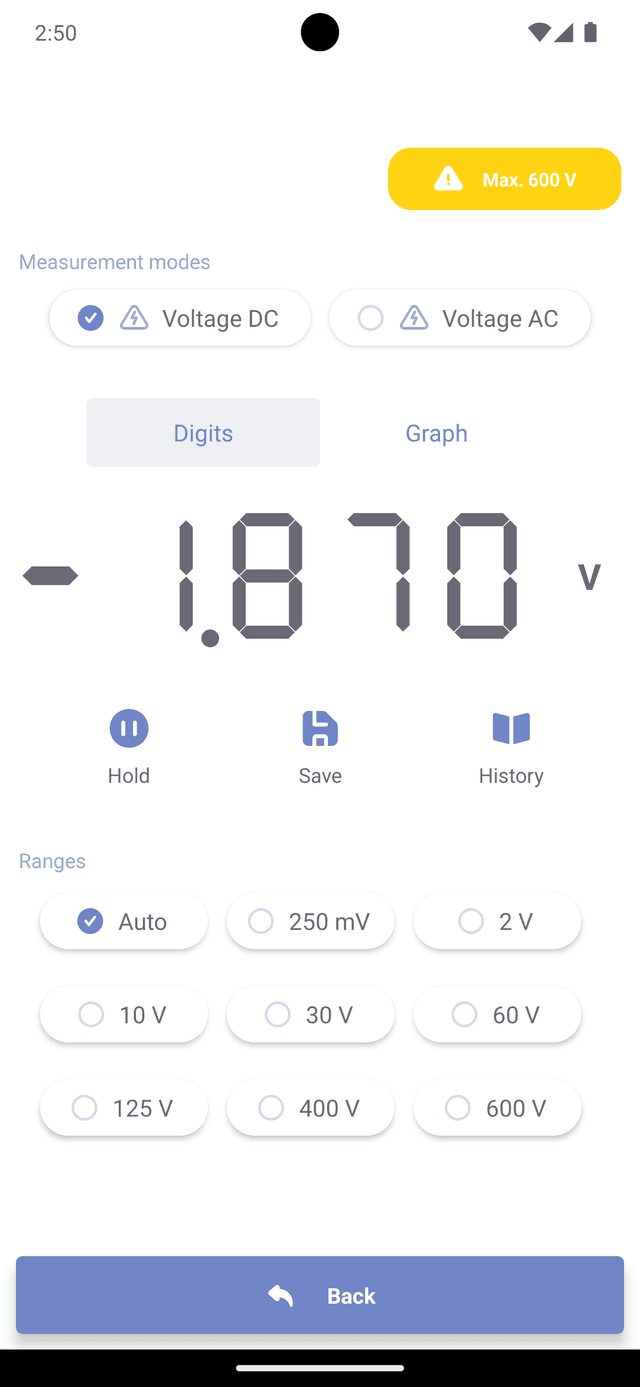
Available multimeter ranges displayed at the bottom part of the screen. Select the appropriate range for your measurement to get most accurate reading. When measured value is exceeding the maximum value for selected range, the app will attempt to select different range and "or" flag will be displayed.
Make sure to not exceed maximum allowed limits that are displayed in the yellow box at the top of the screen.
Controls
You can save currently displayed value with 'Save' button. The values will be stored on the device and can be accessed by pressing 'History' button. Long press on the value, to copy it into the clipboard. You can also export readings to .csv file by pressing 'Export all' button. The generated file will be available in 'Exported files' section in Settings.
'Hold' button will freeze the last recorded value on the screen, until 'Resume' button is pressed.
Graph mode
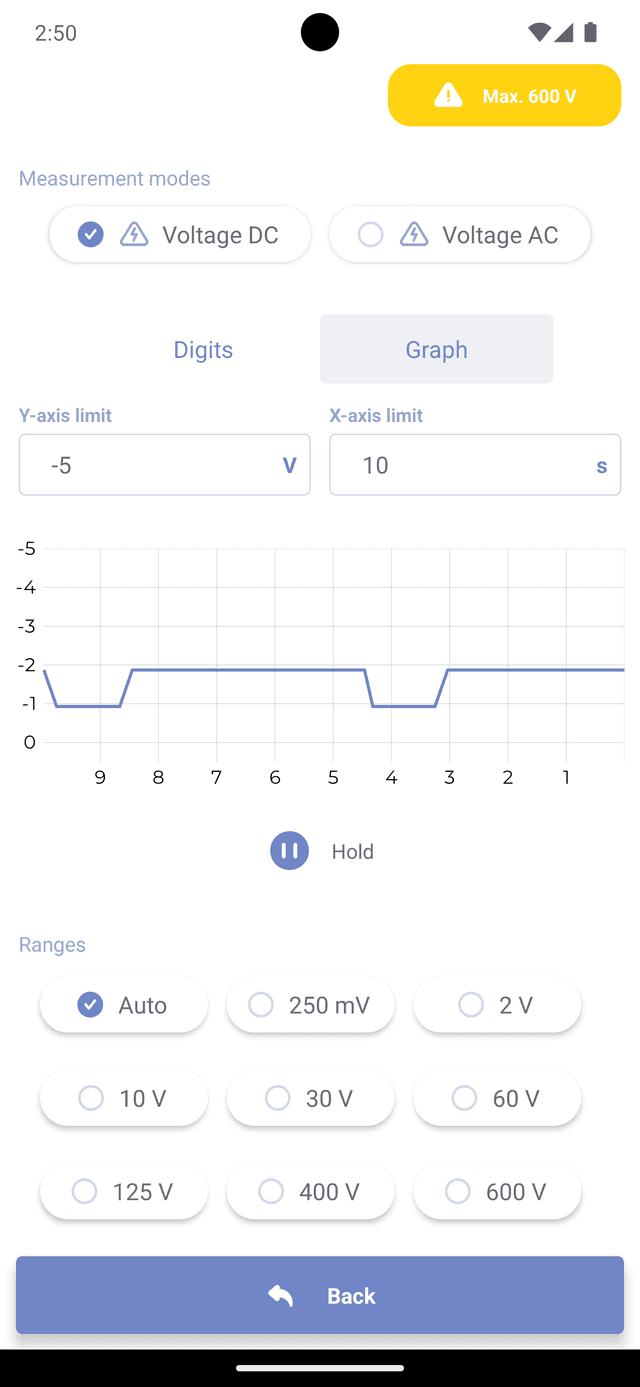
To view readings in a chart, press 'Graph' button. Y-axis represents values (e.g. Voltage or Current), while X-axis represents time. You can adjust max values for the axes in by manually entering them in the fields above the chart.